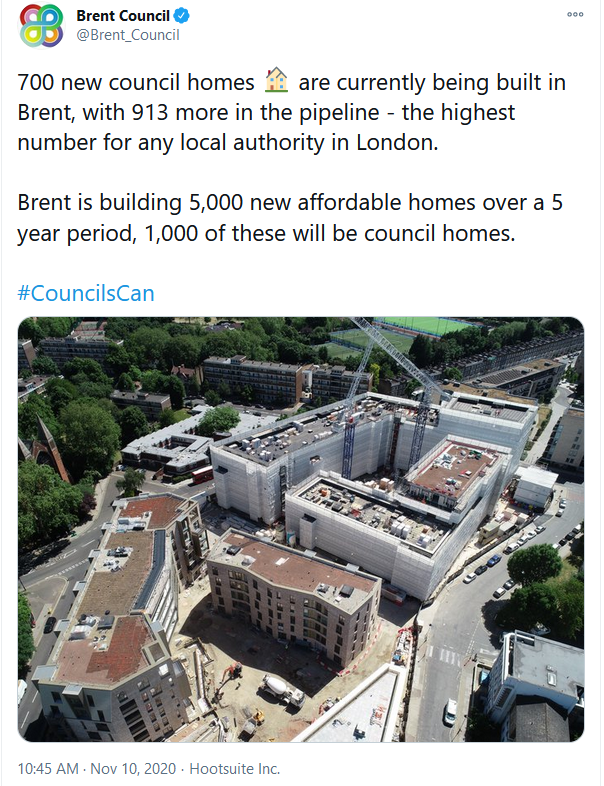
Brent Council’s PR Department has been highlighting the prowess of Brent Council in terms of building new Council Homes.
But what is behind those numbers? We made a freedom of information request, partially answered, about the evolution of the number of council homes in Brent.
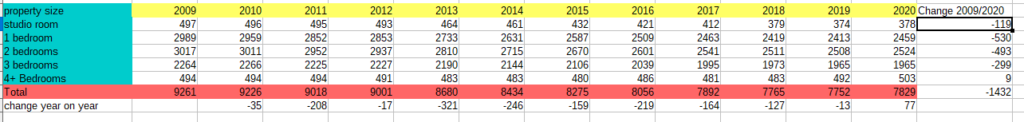
In 2009, Brent had 9261 Council homes. In 2020 Brent had 7829 Council homes. This is a reduction of 1432 Council Homes or 15% reduction. So the 1000 “new council homes” mentioned in the tweet above (within the next 5 years), in fact are in no way new Council Homes but a partial replacement of lost Council Homes.
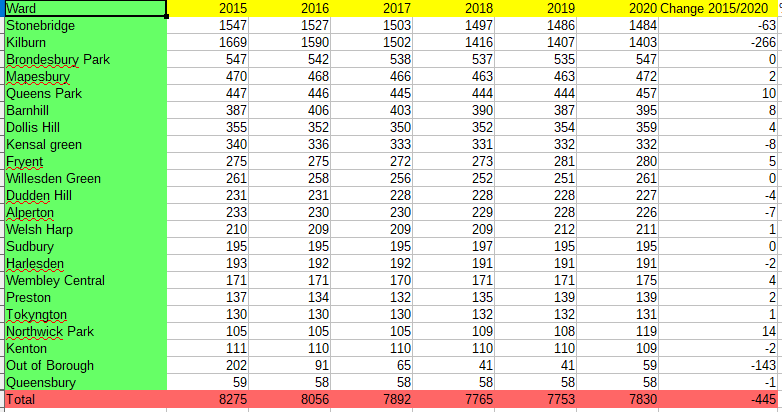
Between 2015 and 2020 Brent “lost” 445 Council Homes. When looking at the data by ward, the losses were the biggest in the following wards; Kilburn -266, Stonebridge -63, out of borough -143.
So what can lead to reduction in the number of Council Homes? The biggest reason in most boroughs is the exercise of “right to buy”, allowing Council tenants to purchase their homes. However it is apparent that in Brent’s case the reduction in the number of Council homes is lead by destruction for redevelopment or desinvestment in out of borough homes. Between Kilburn and “out of Borough”, Brent has lost a total of a total of 329 council homes between 2015 and 2020.
The “new Council Homes” in the Brent Council’s statement should read “Newly built Council Homes” as “new” misleads the readers to believe new means additional Council homes, which really they are not. Conclusion, you should always look behind the numbers before believing what is said in tweet or press release!