
Ordnance survey March 2020
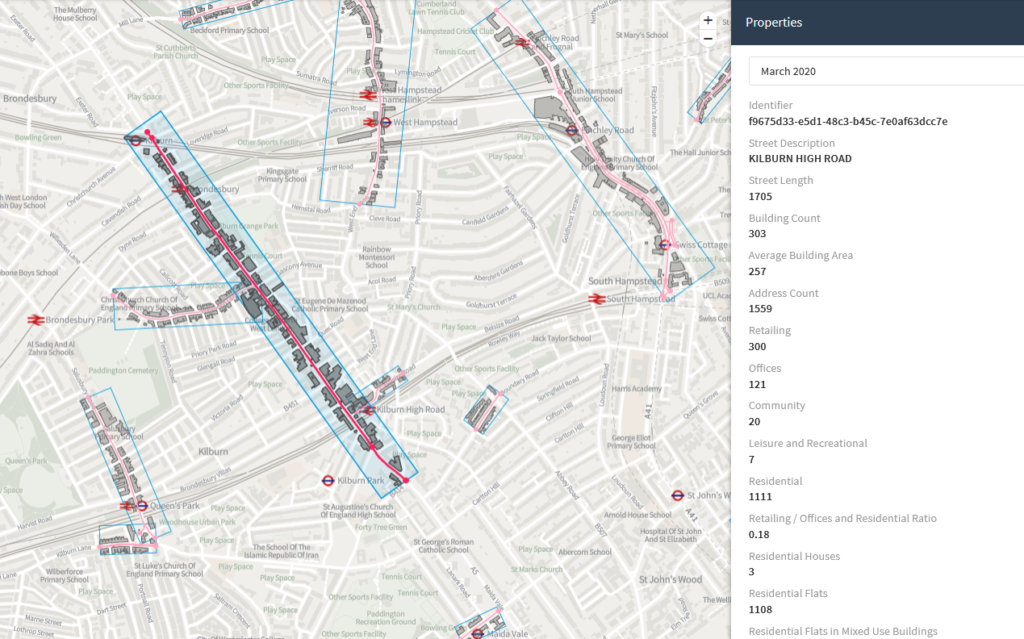
The Ordnance survey has recently published a very interesting map of high streets nationwide, with statistics. Kilburn being one of the major Town Centre is obviously included.
Our High road is changing ,as in the space of a year, the number of residential addresses has increased from 898 to 1111 without a change of number of buildings at 303. This is an increase of more than 24%. This means that either larger properties are being divided into smaller units or that properties have extended their residential surface. This could mean that the number of residential residents on Kilburn High Road as increased by at least 213 persons in a year.
The number of retail units has stayed stable from 299 to 300.
What is noticeable is the size of Kilburn High Road in terms of importance when considered as a whole and not divided into 3 councils. For comparision, Wembley High Road has 242 retail units, Harlesden has 265 retail units, Camden High Street 156 retail units, Kentish Town 134 retail units.
The number of residential addresses at 1111 is also very high compared to other High streets (Wembley 369, Harlesden 855, Camden High Street 306, Kentish Town 522). This means that a large number of residents are exposed to very high pollution levels compared to other high streets.
So our High Road is getting busier, especially now with the current pandemic and people working from home or avoiding public transport when shopping. It is one of the most polluted road in London. Yet the Councils are ignoring the needs of the High Road in terms of public realm investment, more efficient rubbish collections, enforcement of illegal parking and policing. Isn’t time that residents and businesses grouped together to demand better?
| Ordnance survey | |||
| Kilburn High Road | Length 1703m | ||
| 01/03/19 | 01/03/20 | Change 2019 to 2020 | |
| Building count | 303 | 303 | 0.00% |
| address count | 1293 | 1559 | 20.57% |
| Retailing | 299 | 300 | 0.33% |
| Offices | 73 | 121 | 65.75% |
| Community | 17 | 20 | 17.65% |
| leisure and recreational | 6 | 7 | 16.67% |
| Residential | 898 | 1111 | 23.72% |
| Retailing / Offices and Residential Ratio | 0.31 | 0.18 | |
| Residential Houses | 3 | 3 | 0.00% |
| Residential Flats | 895 | 1108 | 23.80% |
| Residential Flats in Mixed Use Buildings | 888 | 1101 | 23.99% |
| Building / Address Count Ratio | 0.23 | 0.19 |