Today the Office of National Statistics released data about usual residents population in England and Wales down to Local authority level following the census of 2021.
We will have to wait a bit longer for details at MSOA level, that will allow us to understand the impact on Kilburn.
Having been a Census Officer, I could not wait to see the data for the Boroughs present in Kilburn.
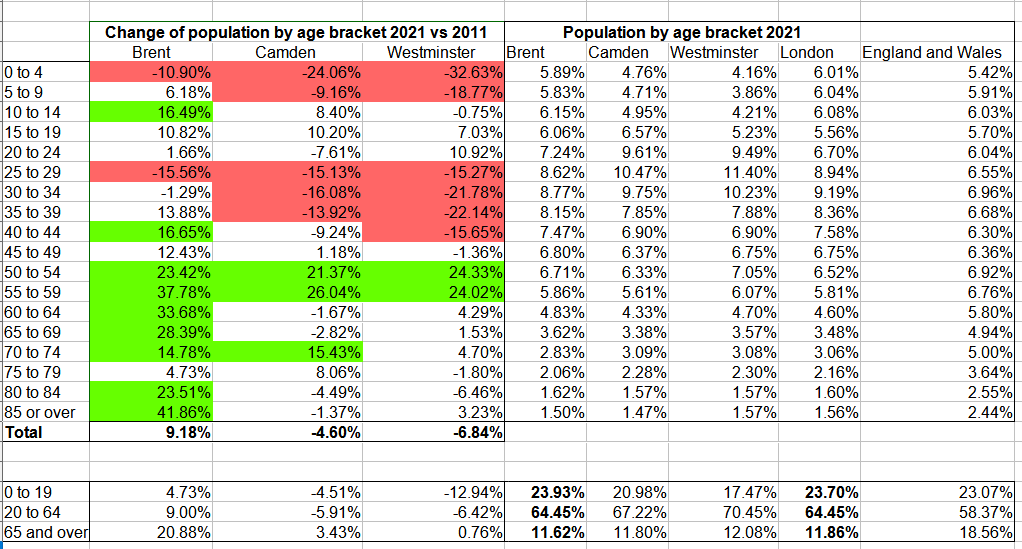
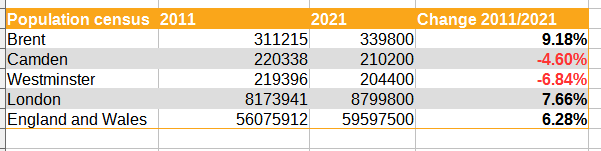
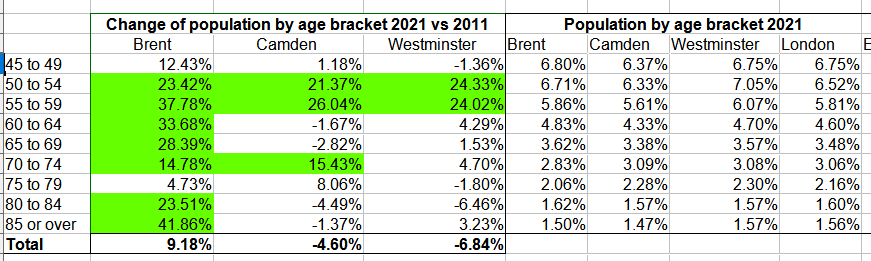
While the population of usual residents increased overall in England and Wales, population in Camden and Westminster reduced quite significantly, by 4.6% and 6.84% respectively. In contrast population in Brent increased much more than nationally ie by 9.18%.
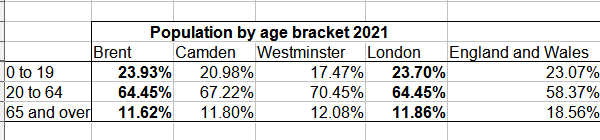
Most of the changes in population have realigned the age pyramid of the 3 boroughs with the London wide age pyramid, with Brent’s age representation being more or less equal to that of London as a whole.
The young working age population (25 to 44) seems to have left Camden and Westminster in troves. This population bracket is still overrepresented in Camden and Westmister but far less than previously. Possibly as a result, the population of young children (0-9) has reduced significantly. This will certainly lead to a rethink of the provision of pre-school and primary school provisions in both Councils. Conversely, in Brent the 25 to 34 population reduced as well quite significantly, leading to a big reduction in the 0-4 age category. Again a rethink of school provisions might be needed. Of note in Brent, is the increase of the 40-44 age bracket (+16.65%) that probably explains the increase in the age bracket (10-14). No wonder there is pressure on Secondary School places in Brent, with many of the children in this age bracket having to attend school out of Borough.
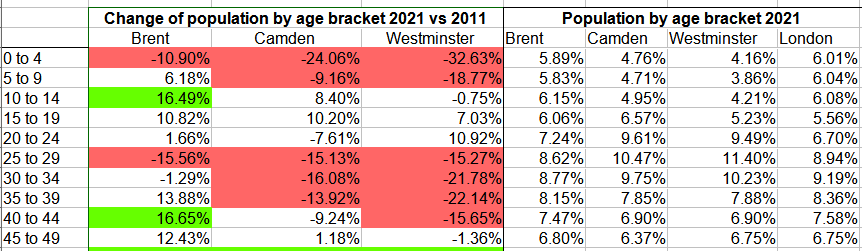
Population increases are significant in the older working age bracket (50-59) in all 3 boroughs, with significant increases in Brent for the population aged 50 and older. These changes in Brent are bringing the age profile of Brent’s population more in line with the rest of London.
There is no doubt that these numbers support what we all suspect. It is likely that the reduction in young working age population is linked to the affordability/availability of housing in our 3 Boroughs. Young working age people are leaving our area to start families and who would blame them when most of the new housing consists of tower blocks or small flats? This should hopefully lead our Local Authorities to rethink housing provision as the “stacking them high” luxury flats approach is not answering housing shortages for young families. The quality, affordability and size of new housing needs to be seriouly rethought. Sadly our system currently looks only at targets in terms of a generic number of housing units rather than size and affordability of housing units. Most housing growth requirements are not qualified by type of housing, ie “you have to deliver 10000 units” and we don’t care if they are small, big, liveable, affordable or not!
A change in housing delivery is most needed as our neighbourhoods need a mix of population to thrive and a mix a population can only be achieved with affordable mixed sized housing. Wonder if the young generation that has left our Boroughs will ever come back to drive the dynamism of our neighbourhood! I am not sure they will, as the current trend to divide family sized housing continues. In my road, all Victorian houses have now been converted into small flats or turned into HMO’s.
Food for thoughts and a lot of numbers to go through. Can’t wait to see more data released soon.
Please find below the full table that I created from this.